Project 3 Response - Geo Raster
This is a report of Project 2. In this project, I used geospatial variables to model the population of the Irbid Governorate of Jordan. I chose this region because it is the most densely populated governorate of the country.
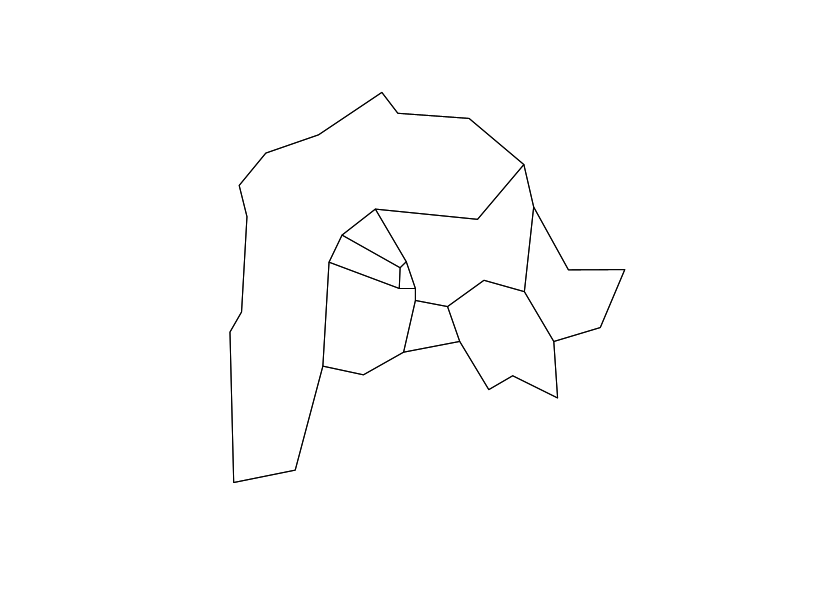 Simplified map of the Irbid Governorate
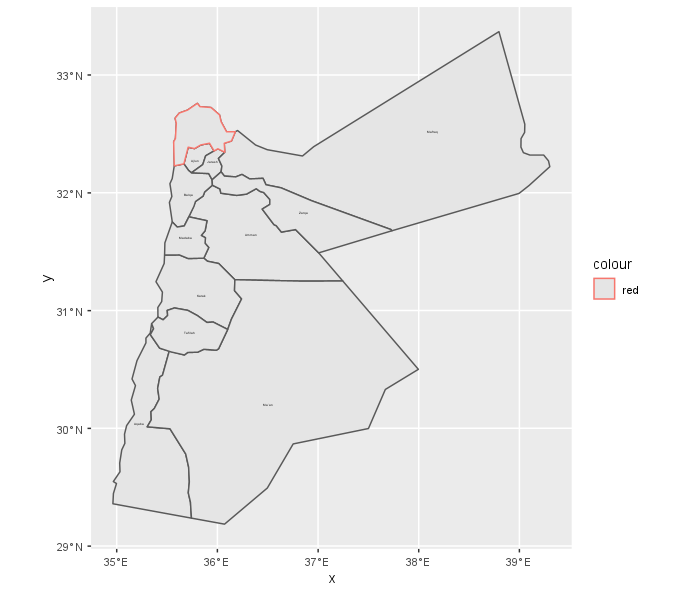 Location of the Irbid Governorate in Jordan
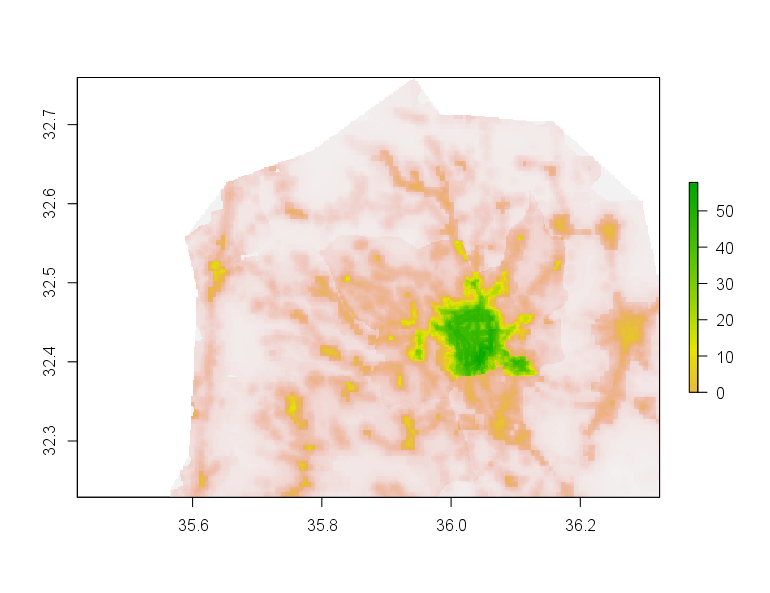 Population of the Irbid Governorate
I first used the linear regression model for my prediction. The resulted prediction is as follows:
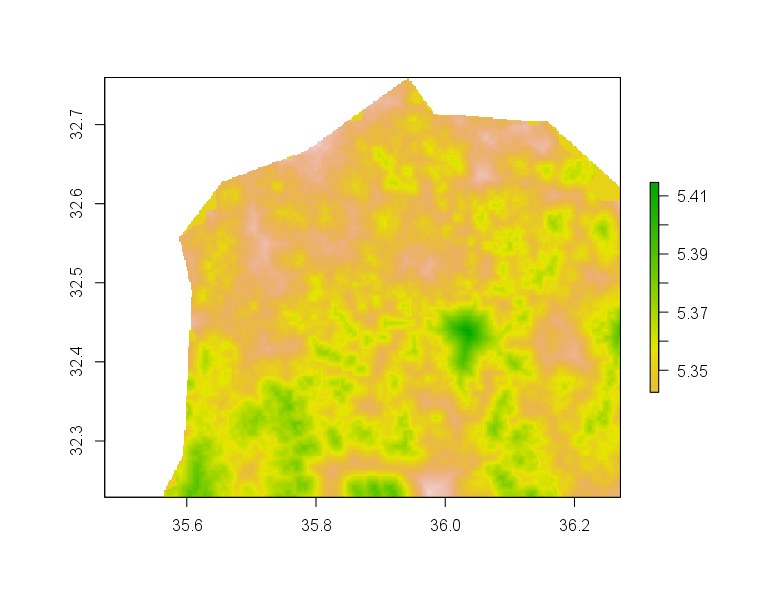
Then the difference between the prediction and the actual population can be seen below:
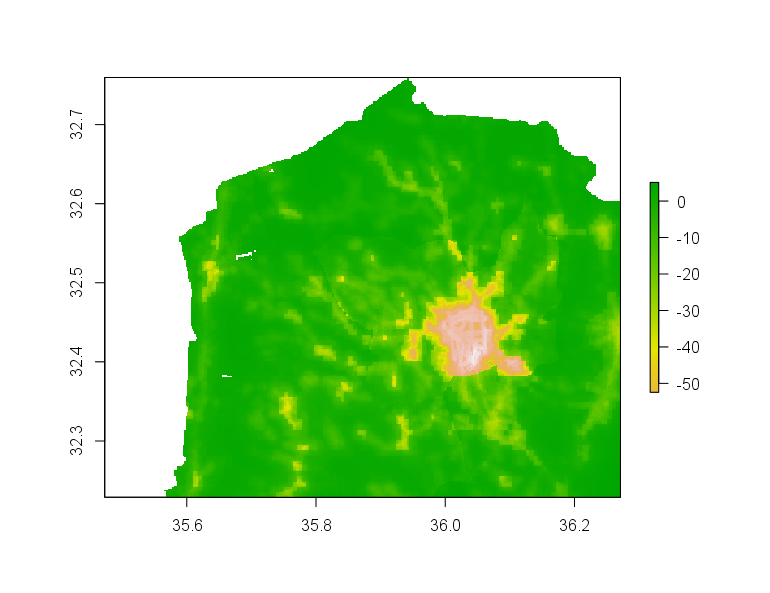
Then the plot of the mean error, mean absolute error, and root mean squared error are as follows:
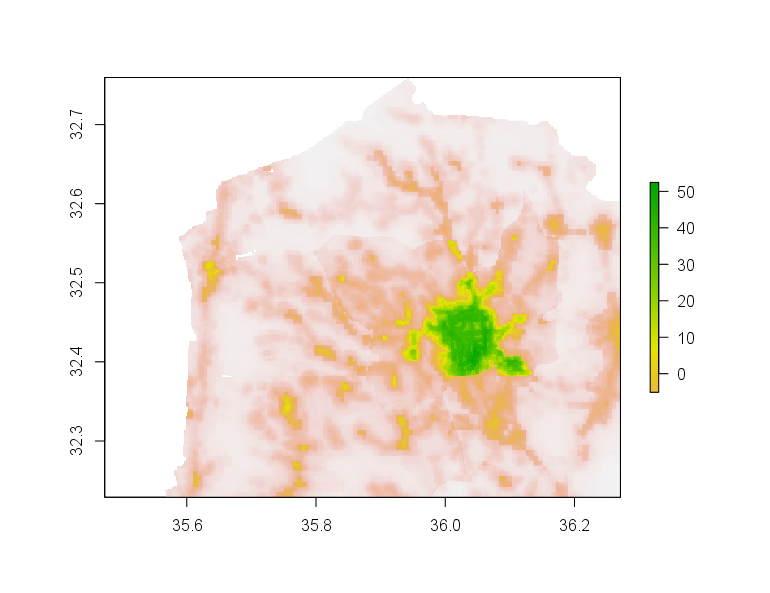 Mean error
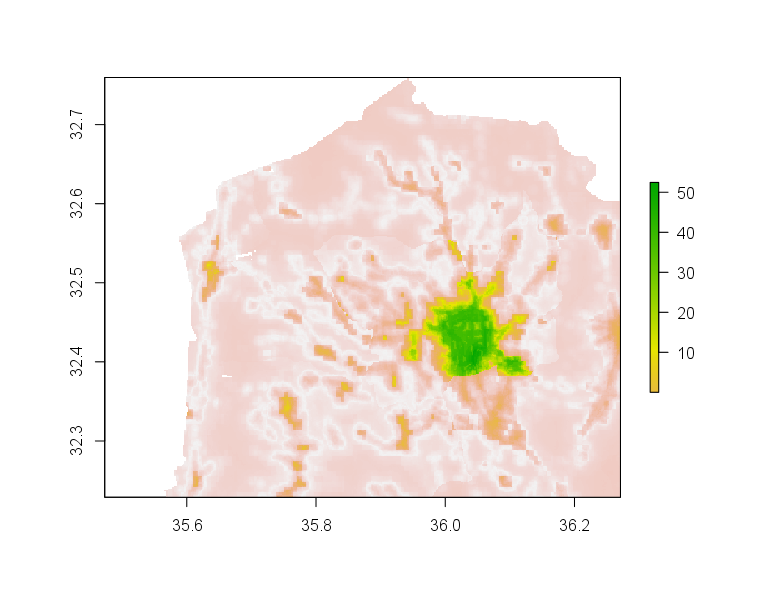 Mean absolute error
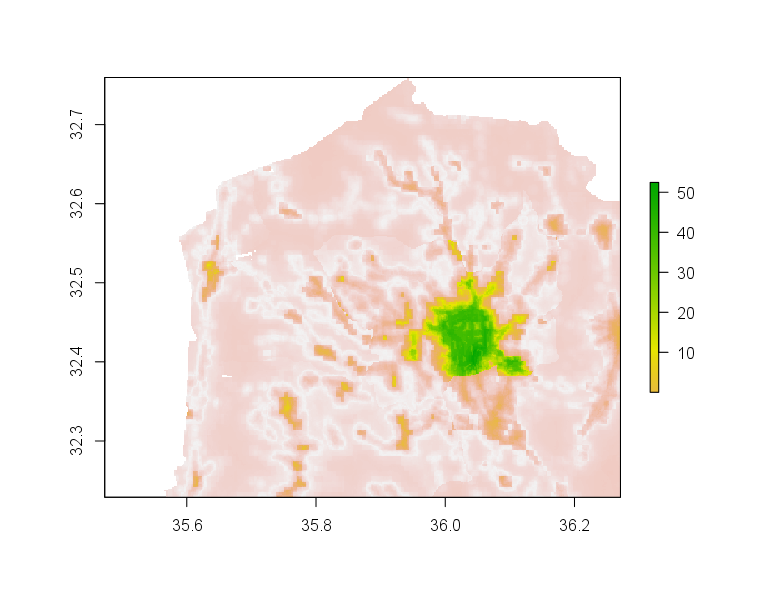 Root mean squared error
Then I used the random forest model. For some reason, the resulted prediction is uniform in all areas:
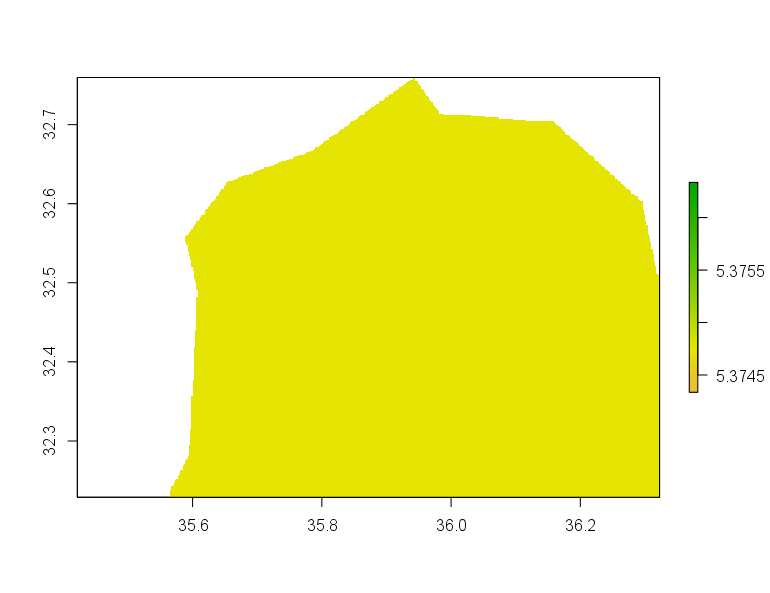
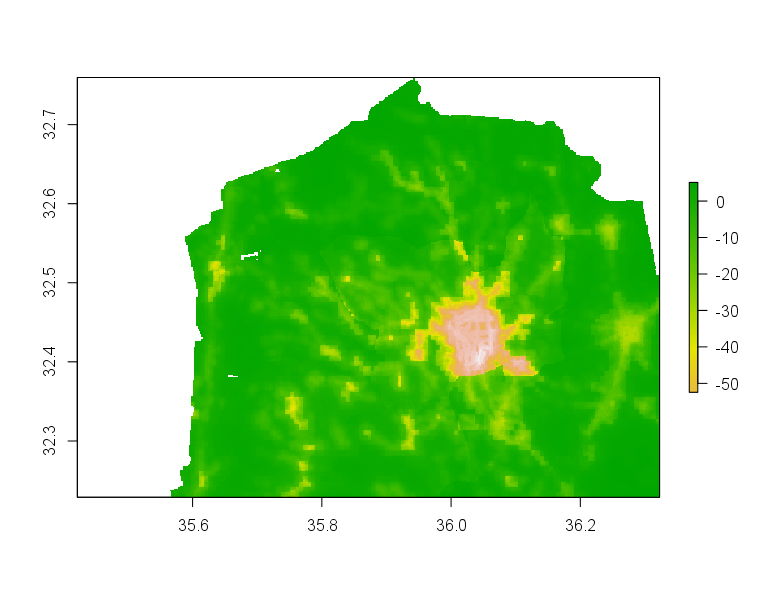
Therefore the difference between the prediction and the actual population can be seen below:
The plot of the mean error, mean absolute error, and root mean squared error are as follows:
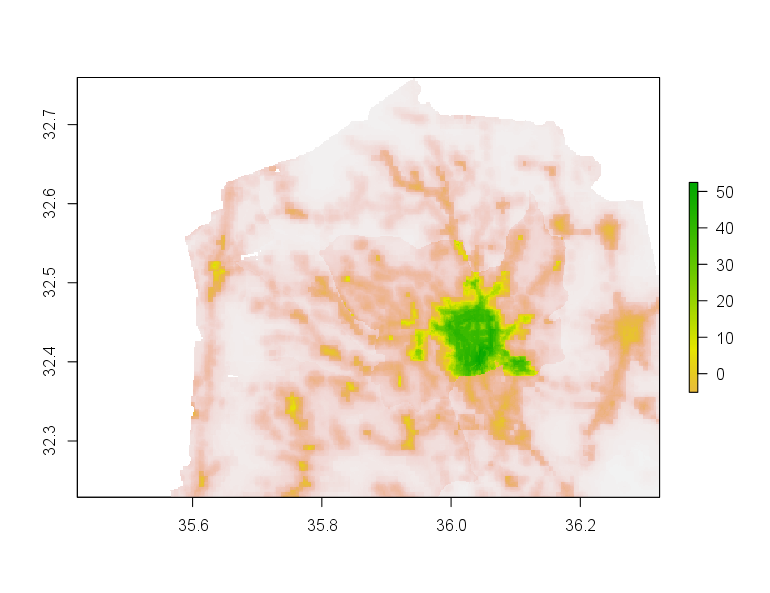 Mean error
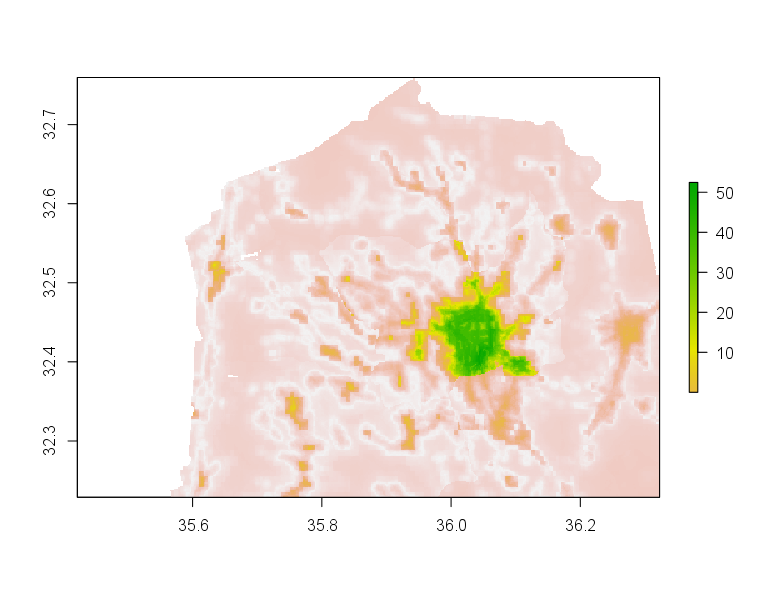 Mean absolute error
 Root mean suqared error
Judging from the results above, linear regression model is the more accurate model, since the results of random forest show no variation.
The spatial variation throughout the selected area may be attributed to the existence of metropolitan areas. The area with the largest difference and variance in the linear regression model is where the city of Irbid is located, the largest city of the region and the second largest metropolitan area in Jordan. Although some characteristics of urban areas can be reflected by night time light, this variable is not the best indicator of urban areas, since the density of urban residential areas might result in a small difference of night time light from the rural areas.
Scripts
R script for project 3 can be accessed here.